After installing my pfSense firewall a couple of months ago, I have been wanting to get a nice dashboard built in Splunk. I will be building on the Snort configuration found in my last blog reviewing the Netgate-1100. (See Here) In this blog I show how to install and configure the pfSense Splunk application “TA-pfSense” in preparation for accepting the logs delivered from pfSense. I then extract some fields to better build queries for the dashboards needed. Last, I show the queries I use for visualizing key data from pfSense.
I am using Snort for traffic inspection for malicious or suspicious behavior.
What is Snort?
“Snort is an open source network intrusion prevention system, capable of performing real-time traffic analysis and packet logging on IP networks. It can perform protocol analysis, content searching/matching, and can be used to detect a variety of attacks and probes, such as buffer overflows, stealth port scans, CGI attacks, SMB probes, OS fingerprinting attempts, and much more.” Source – https://www.snort.org/faq/what-is-snort
For instructions on installing the Snort module for pfSense check out my previous write-up here.
Getting The Logs
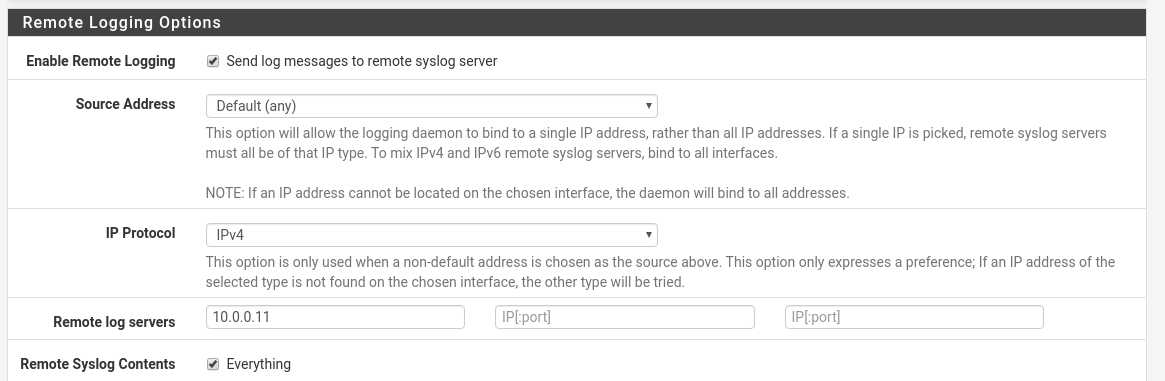
First, configure pfSense to send all the logs to the Splunk server. Status -> System Logs
Click the settings tab, scroll to the bottom of the page and check the “Enable Remote Logging” option. Leave the Source address as default to get logs from any interface. In the remote log servers text box you can collect using 514 UDP by default by not specifying a specific port. Last check the “Everything” checkbox to get ALL the logs from the system.
Now lets move over to the Splunk server and take a look at what we are getting so far.
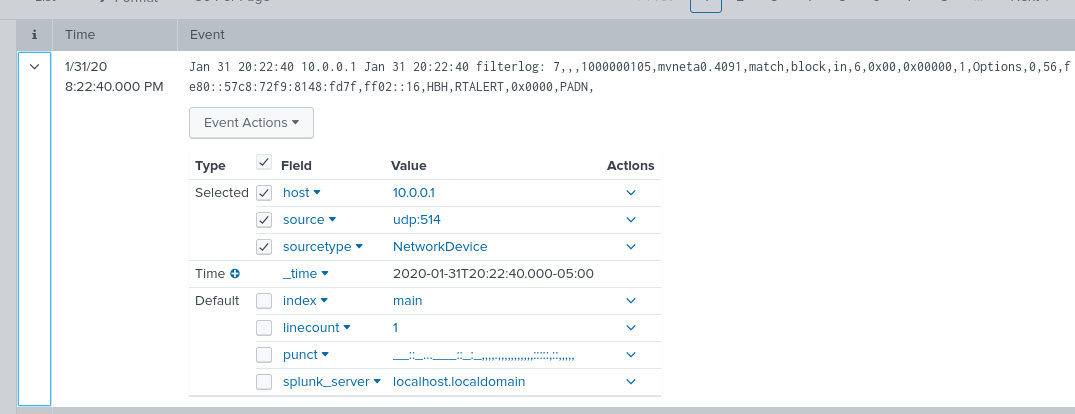
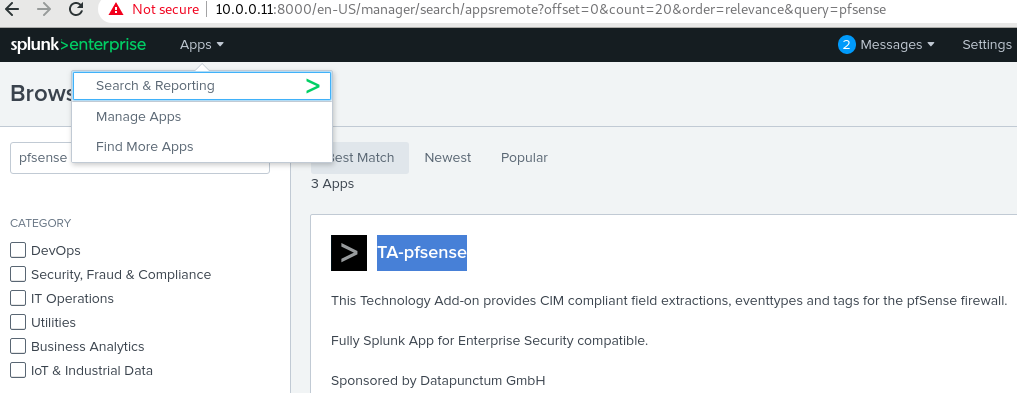
As you can see, not much is being parsed out from the log. Also take note of the source type “NetworkDevice”. Now lets address this by grabbing the application built for Splunk called TA-pfsense.
Navigate to manage apps, and install TA-pfsense.
Installing this app creates a new directory located in /opt/splunk/etc/apps called TA-pfsense. Navigate to this directory and find the inputs.conf.sample file in the default directory.
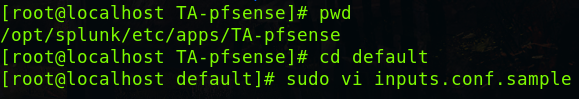
Update the port number to your desired port and save the file. (Remember to open any ports that are not already open with firewalld)
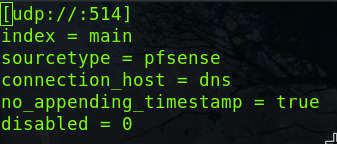
Now lets knock off the .sample on the file and restart Splunk.

Lets see how we are looking in Splunk now.
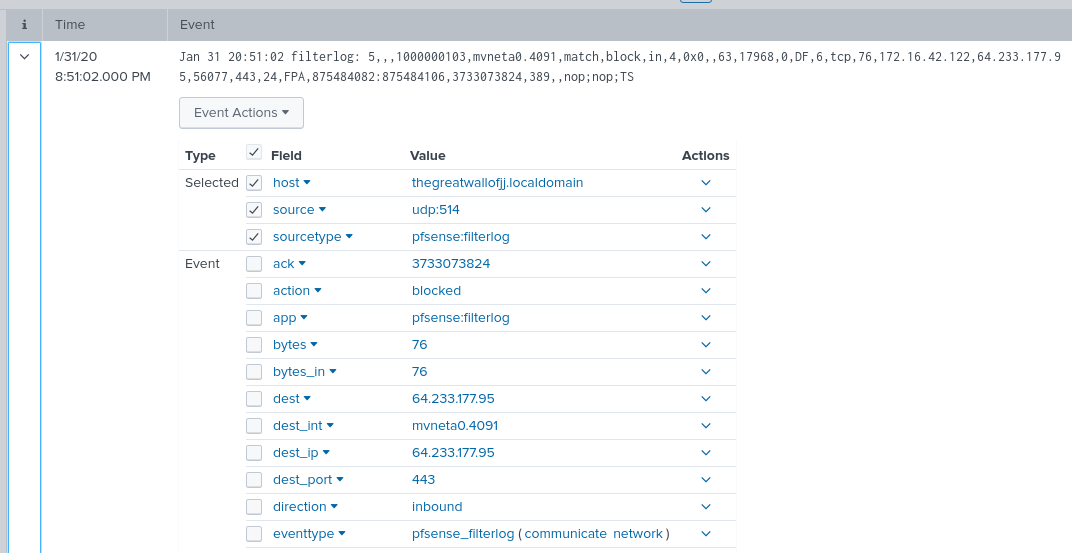
Now all the fields are nicely parsed and ready for queries.
Building The Dashboard
Lets set some dashboard goals. What data do we want to see from the pfSense dashboard?
- Total Bytes Sent & Received
- Snort Alerts
- Attack Map
Total Bytes Sent & Received
Pulling the total data send and received is already parsed with the TA-pfSense app found with sourcetype “pfsense:filterlog”. We can start with getting the total bytes from source and destination IP with the following querys:
index=main sourcetype="pfsense:filterlog" | stats count(bytes) as TotalBytes by src_ip index=main sourcetype="pfsense:filterlog" | stats count(bytes) as TotalBytes by dest_ip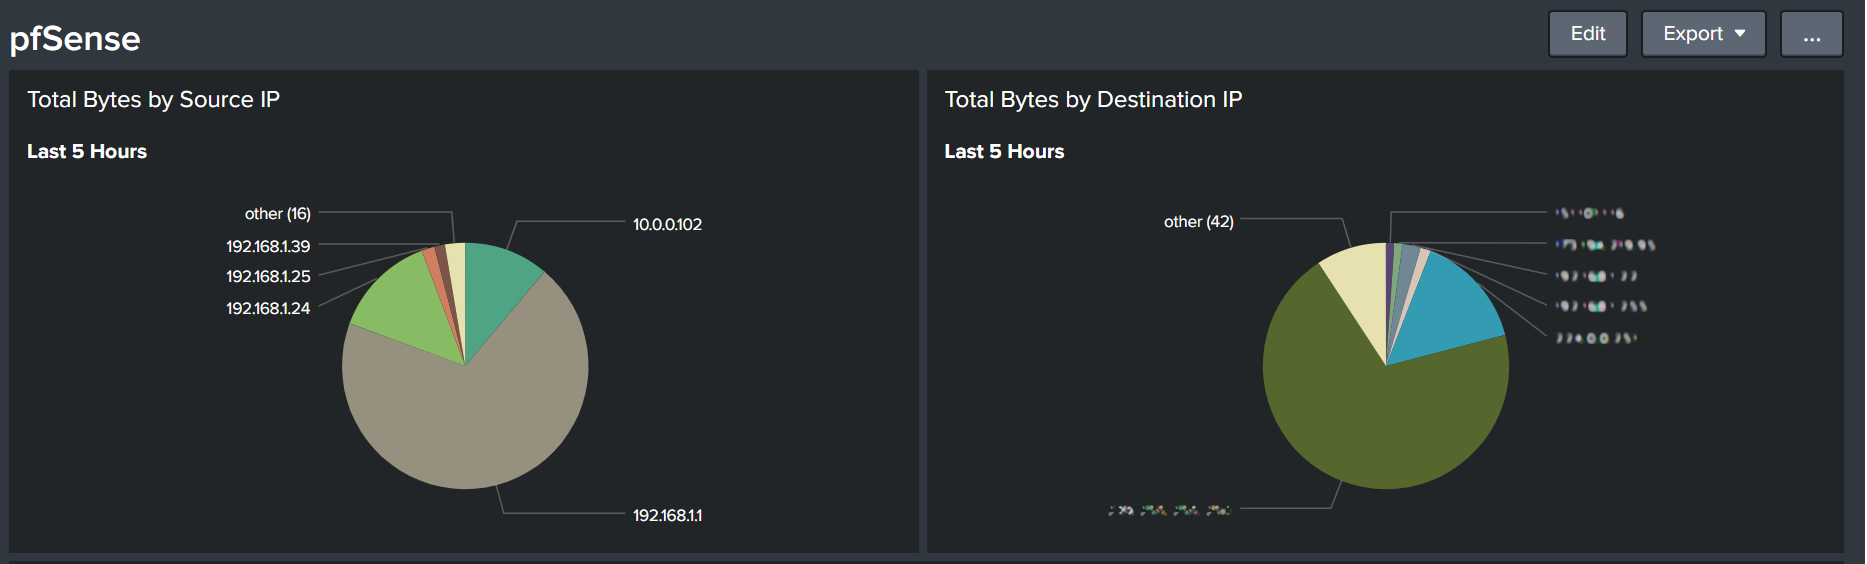
I just dropped the tables into pie graphs as a personal preference.
Snort Alerts
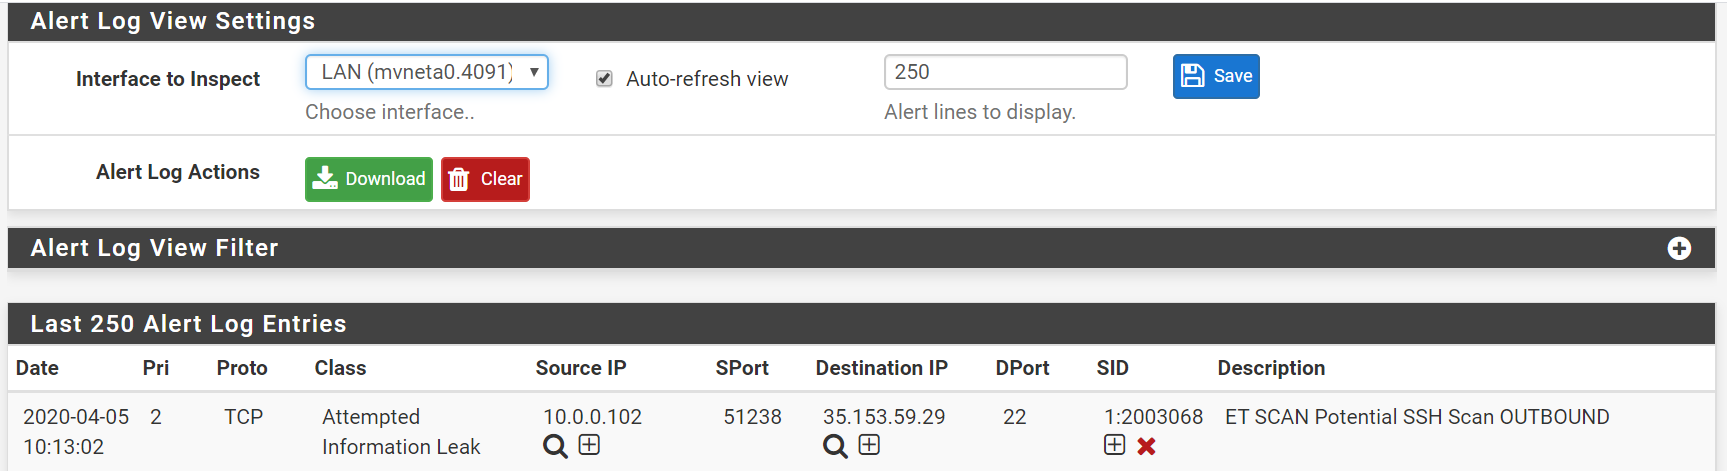
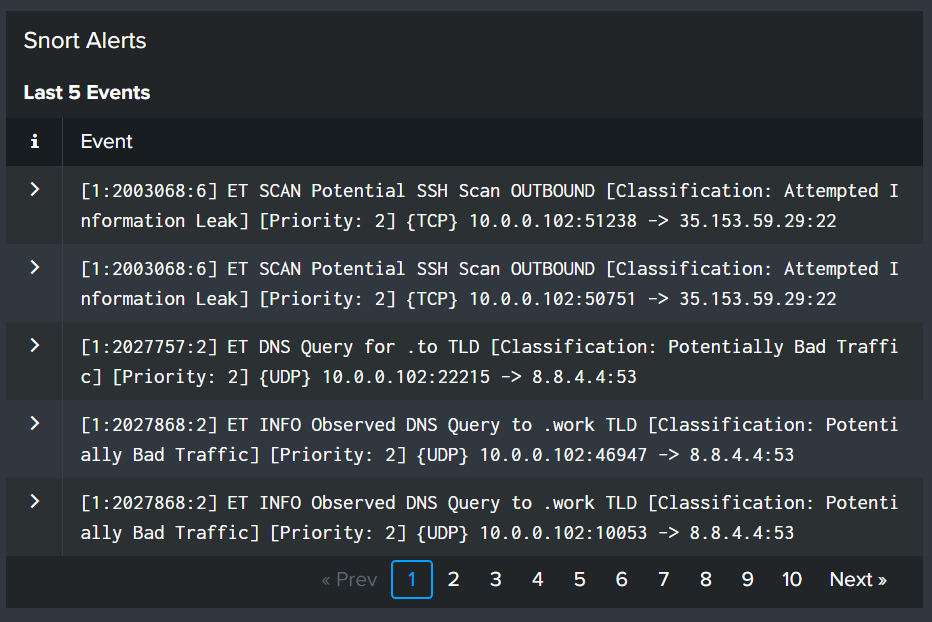
The Snort alerts are not parsed by the TA-pfSense application, so more configuration will be needed. Lets start by searching for the date and time alerts are seen in pfSense (Snort). Here we see a “Potential SSH Scan OUTBOUND” from 10.0.0.102.
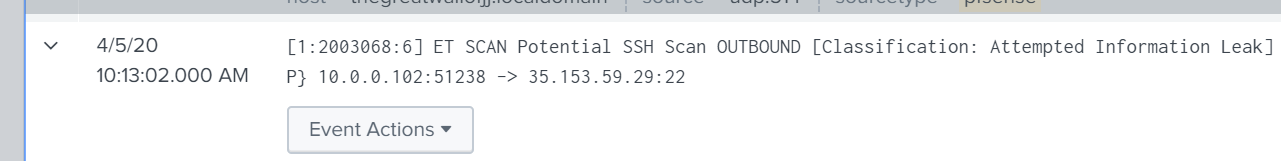
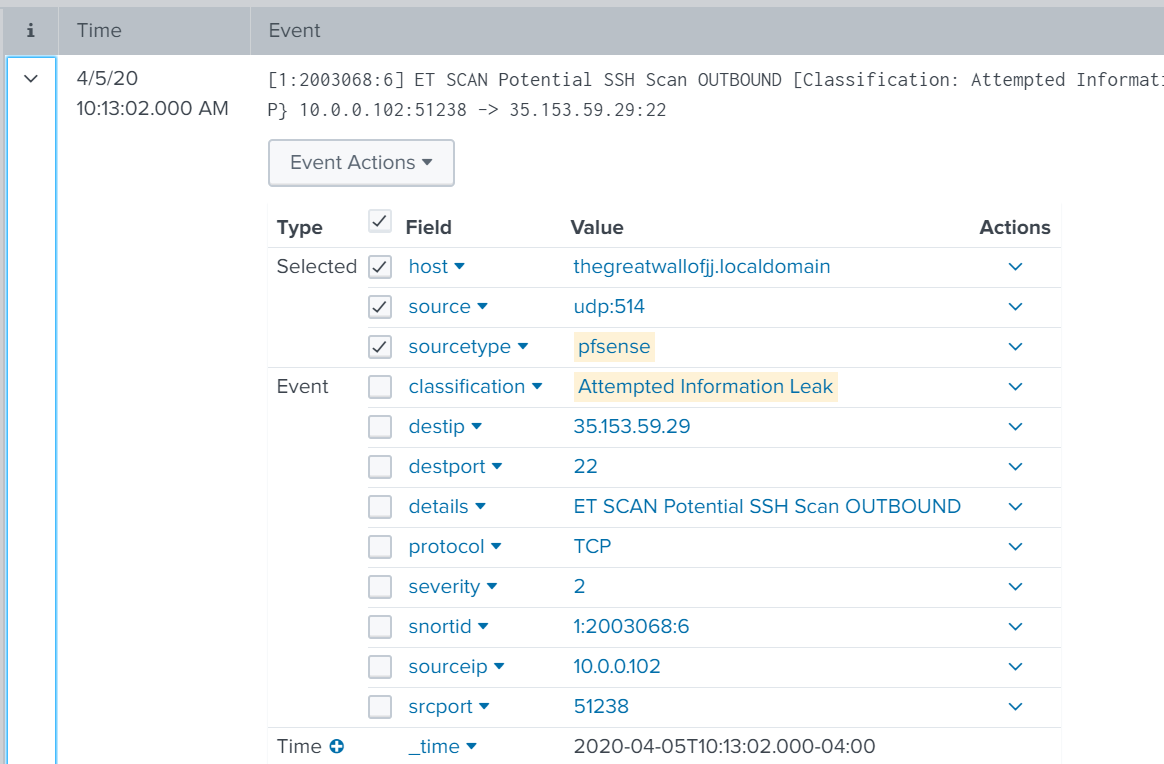
Now if we search for events at 10:13am in Splunk we see the event we will be working with.
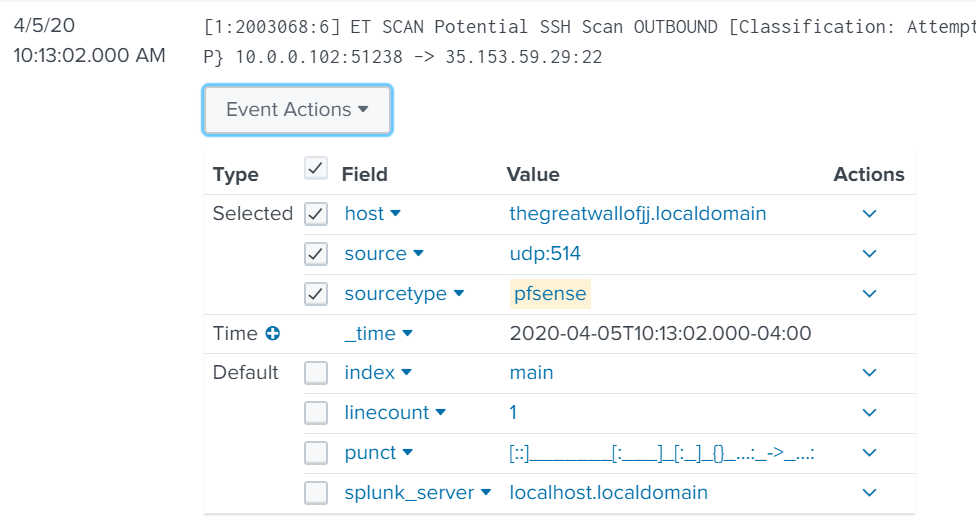
Looking at the details of the event, we see that nothing is parsed correctly. We can easily fix that by extracting fields using regex.
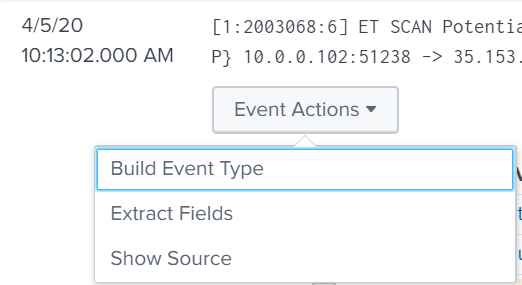
Within the event details, click the Event Actions drop-down and select Extract Fields.
Below you will see my extracted fields breakdown:
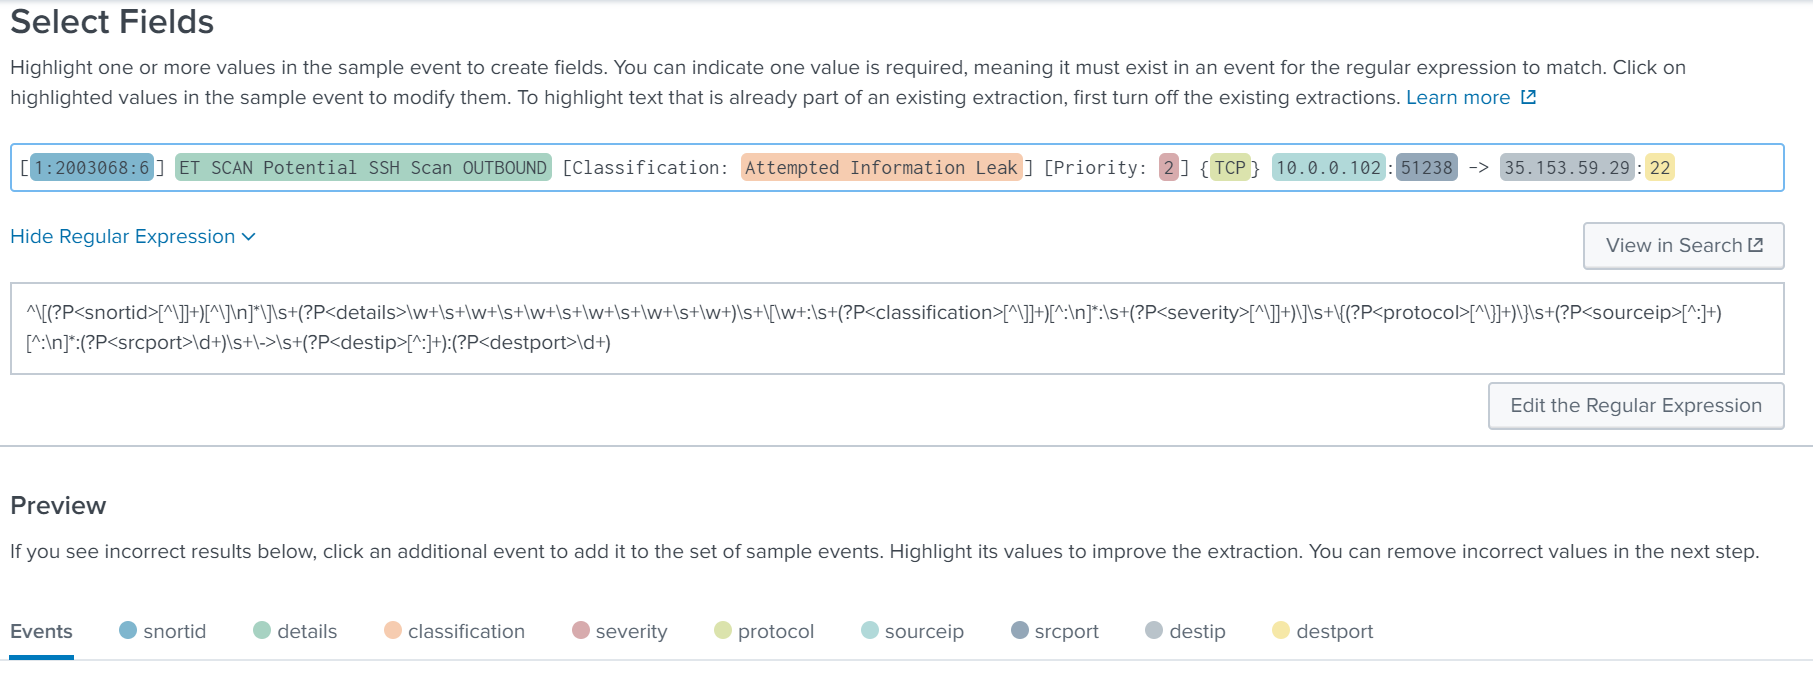
Extracted Fields:
- snortid
- details
- classification
- severity
- protocol
- sourceip
- srcport
- destip
- destport
Regular Expression:
^\[(?P<snortid>[^\]]+)[^\]\n]*\]\s+(?P<details>\w+\s+\w+\s+\w+\s+\w+\s+\w+\s+\w+)\s+\[\w+:\s+(?P<classification>[^\]]+)[^:\n]*:\s+(?P<severity>[^\]]+)\]\s+\{(?P<protocol>[^\}]+)\}\s+(?P<sourceip>[^:]+)[^:\n]*:(?P<srcport>\d+)\s+\->\s+(?P<destip>[^:]+):(?P<destport>\d+)Save the configuration and lets search for a unique field we just extacted.
index=_* OR index=* sourcetype=pfsense classification=*Now we can work with the data for building the pfSense Snort dashboard.
I want one panel on the dashboard to have the raw event so lets to a save as on the search above.
Attack Map
As you know we can not have a firewall dashboard without the sourceip attack map. For this we can use a simple command in splunk called iplocation and geostats to do a lookup on the IP to determine the latitude and longitude of an attacking IP. We parsed the IP addresses for the snort rules above, so now we just need to write a query for the specific log source.
index=_* OR index=* sourcetype=pfsense classification=* | iplocation sourceip | geostats latfield=lat longfield=lon count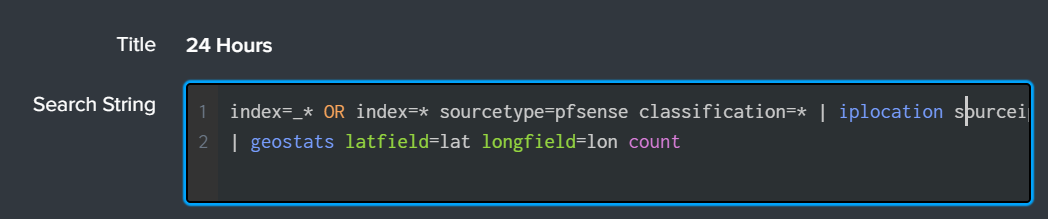
I am using a wildcard for the index and specifying the “pfsense” sourcetype. Since the classification field is unique to the Snort rule logs we can wildcard it as well. Now we pipe those results into “iplocation” for the “sourceip” followed by the “geostats” to count the latitude and longitude fields for the attack map.
From here just select visualizations and choose the cluster map.
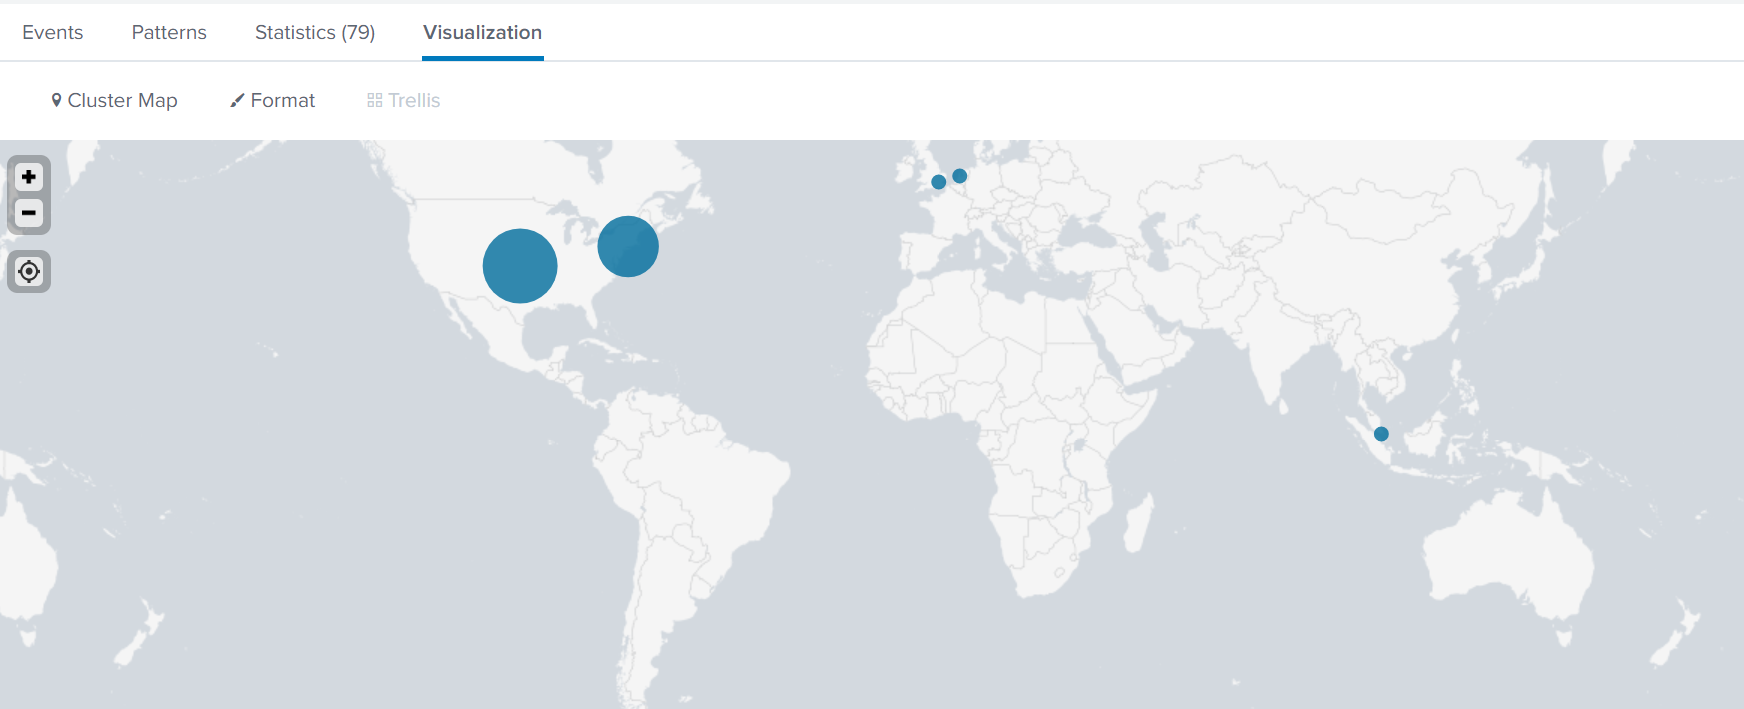
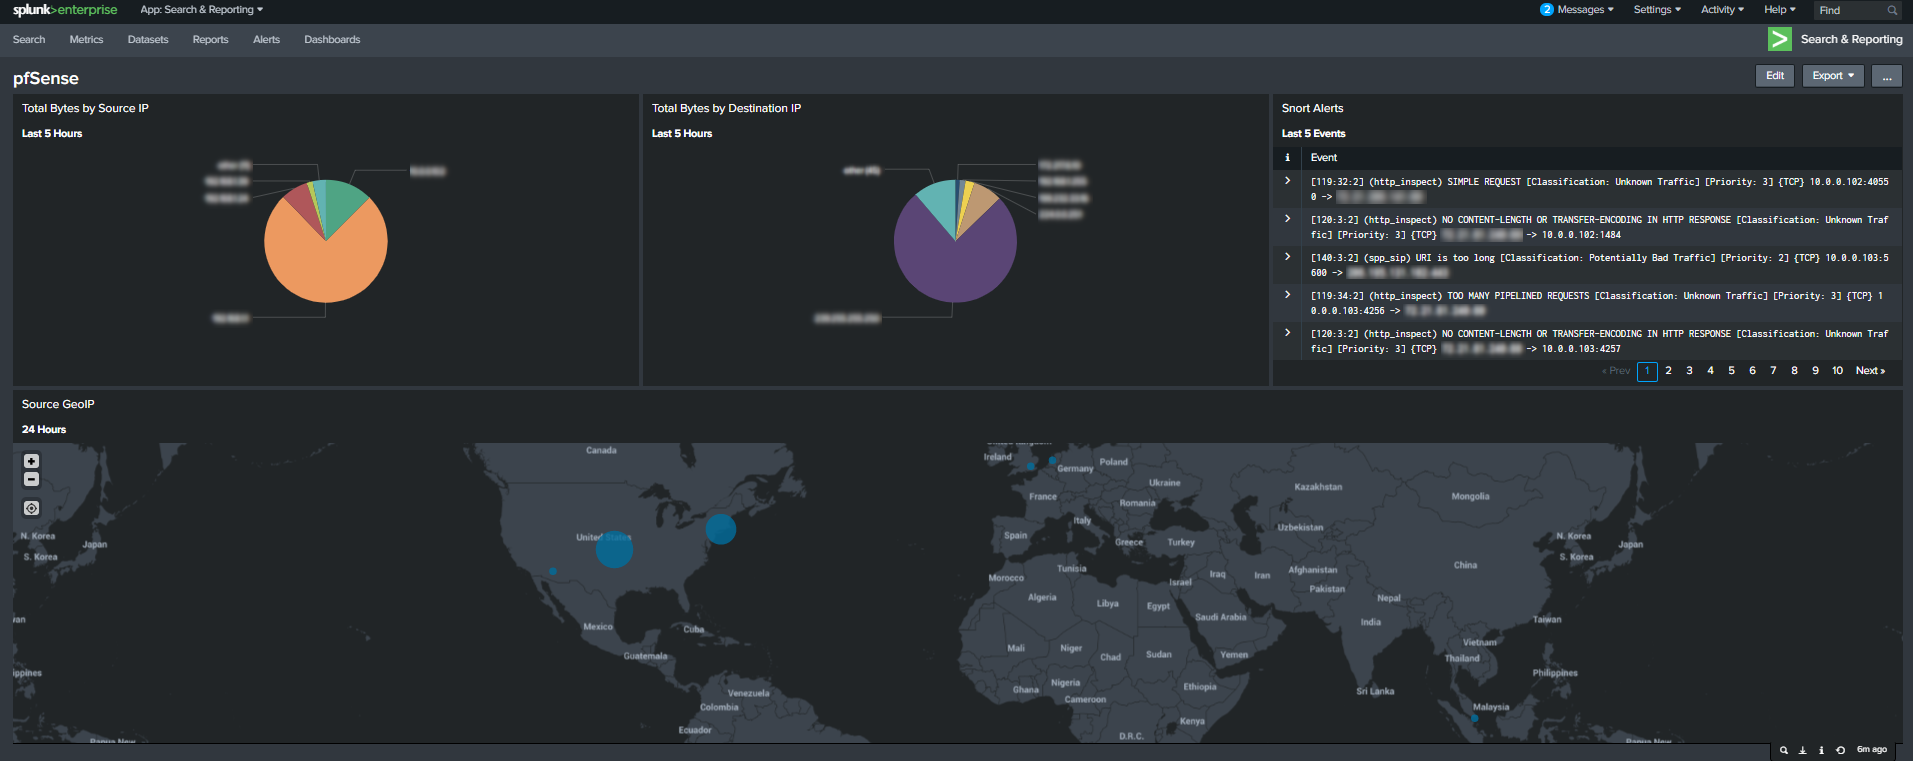
Final Dashboard
Now finalize the dashboard to your preference. Here is how my final dashboard looked for pfsense.

This dashboard provides me a quick visualization of what IPs are using the most bandwidth on my network in order to detect issues. We can also use this data to discover anomalies that may indicate C&C activity in the future. Next, the raw snort alarms give me quick in-depth details to investigate suspicious traffic. Last, the cluster map provides me possible risky sourceips “at a glance”.
Keep an eye on your network, and until next time, stay safe in the Trenches of IT!